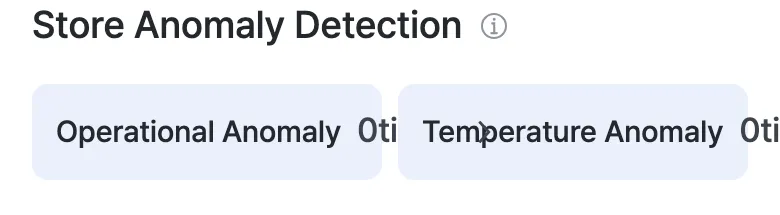
Store Anomaly Detection
Scroll down the Real-time screen to find the Store Anomaly Detection area. It summarizes today’s anomalies into two counts — Operational Anomaly and Temperature Anomaly.
About the example screens
The list/detail example images on this page use demo store data to show what an anomaly looks like when one occurs. When the store is normal, you’ll see the “empty” screens below instead.
Operational Anomaly
Tap the Operational Anomaly card to open the operational anomaly list by date. It collects operations-related situations such as a missing uniform, an unattended register, or an outsider at the register.
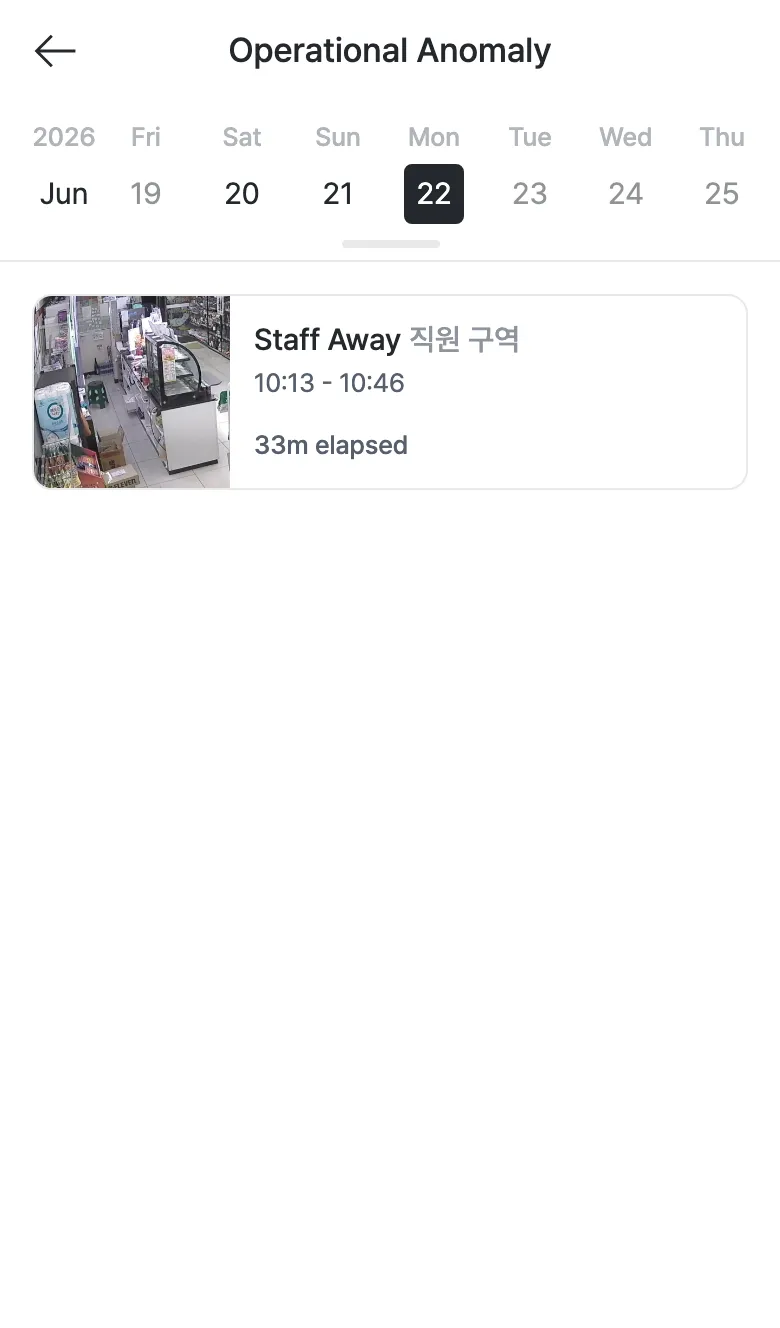
- Pick another date on the date strip at the top to view that day’s records.
- Each item shows an on-site snapshot along with the type, area, time, and duration.
- Tap an item to open the detail screen.
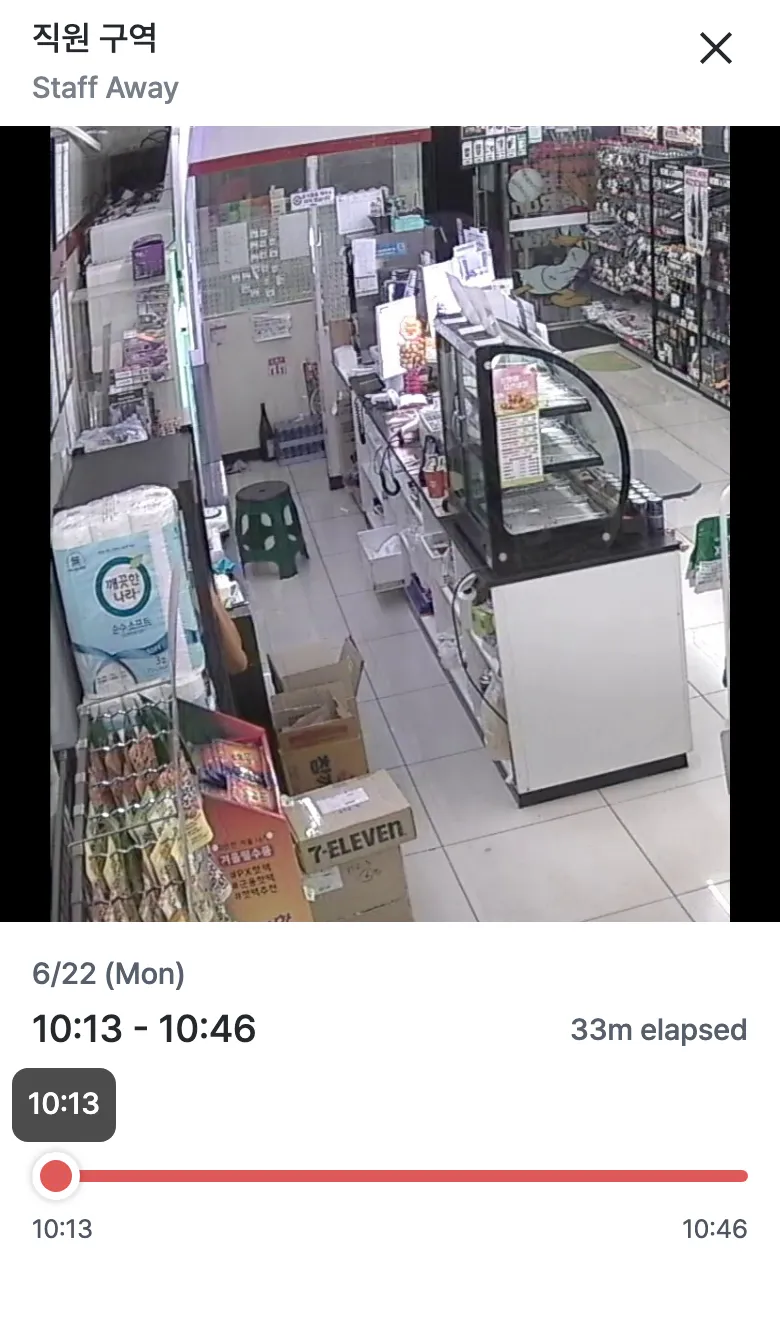
On the detail screen you can check the area and type, the start–end time and duration, and replay what the spot looked like with the time-based snapshot play bar.
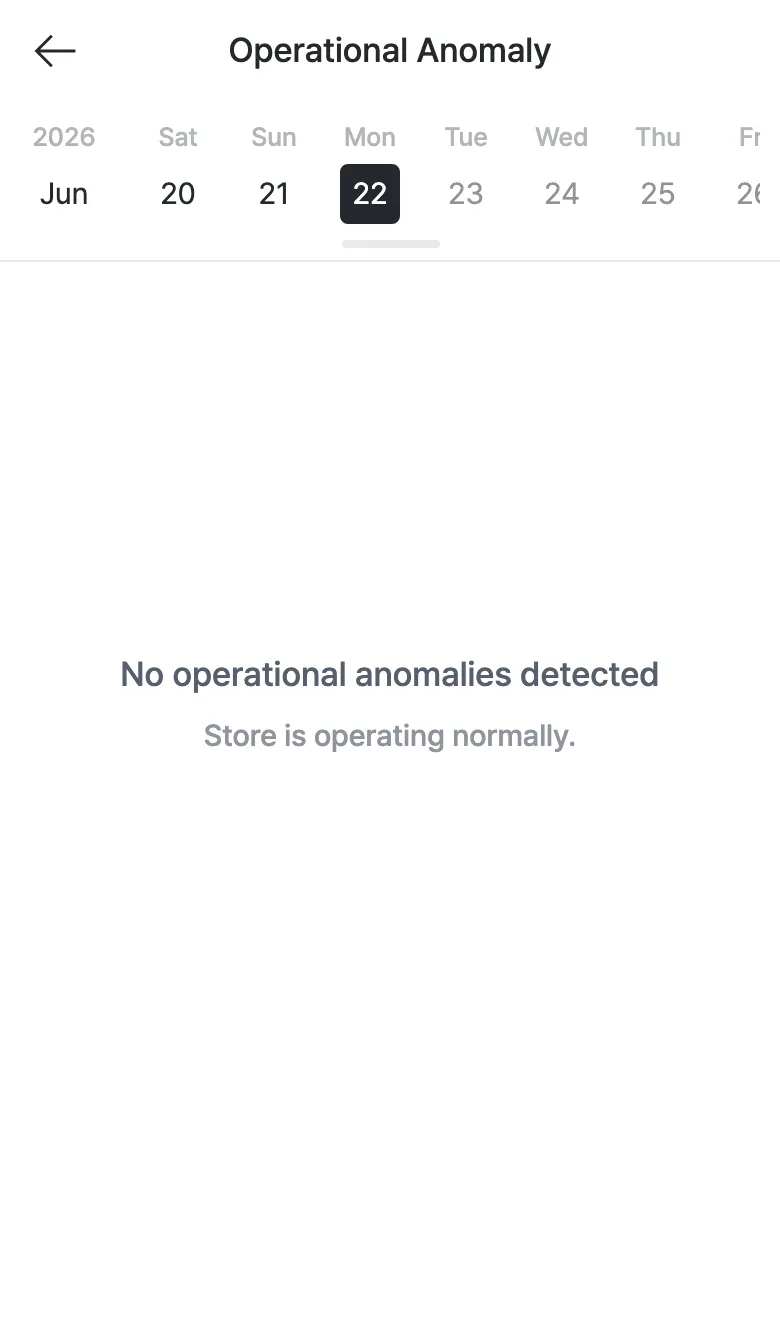
If there were no operational anomalies today, an empty screen is shown.
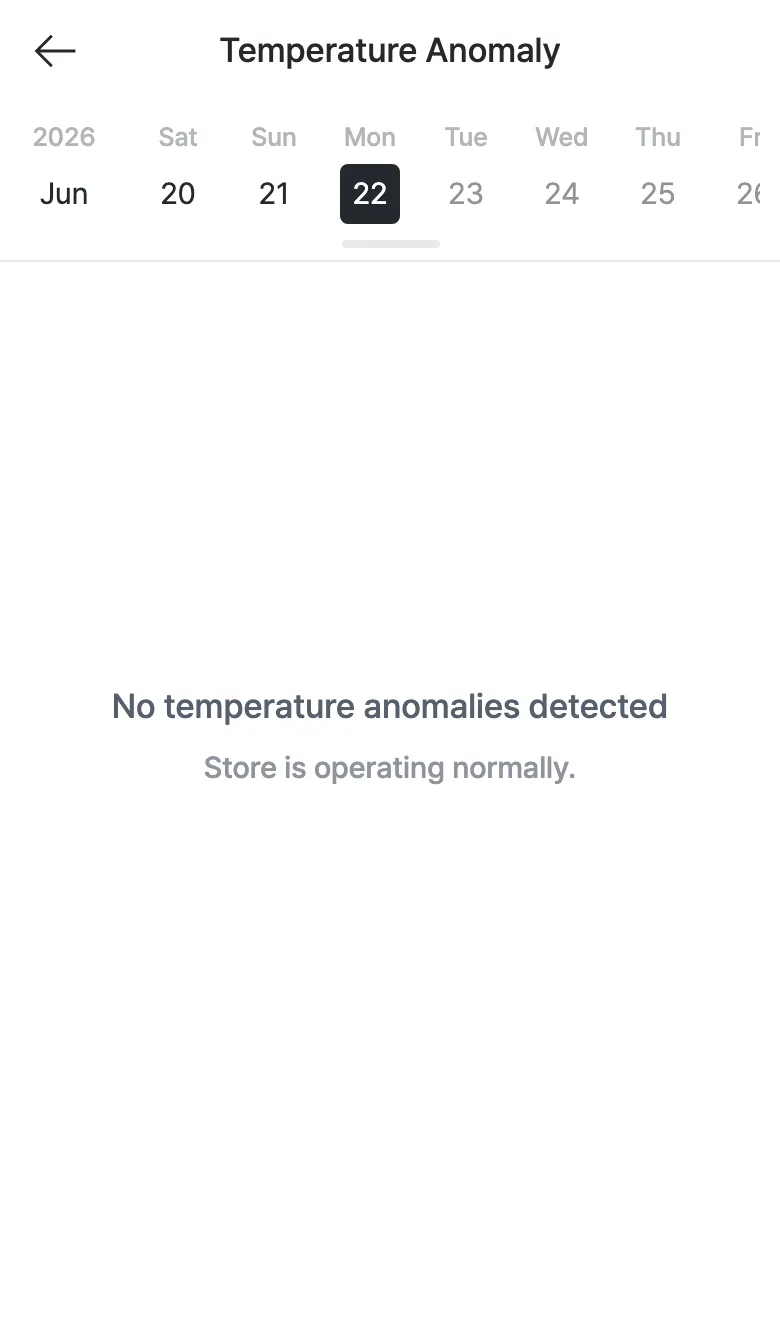
Temperature Anomaly
Tap the Temperature Anomaly card to check the status of refrigeration and freezer units.
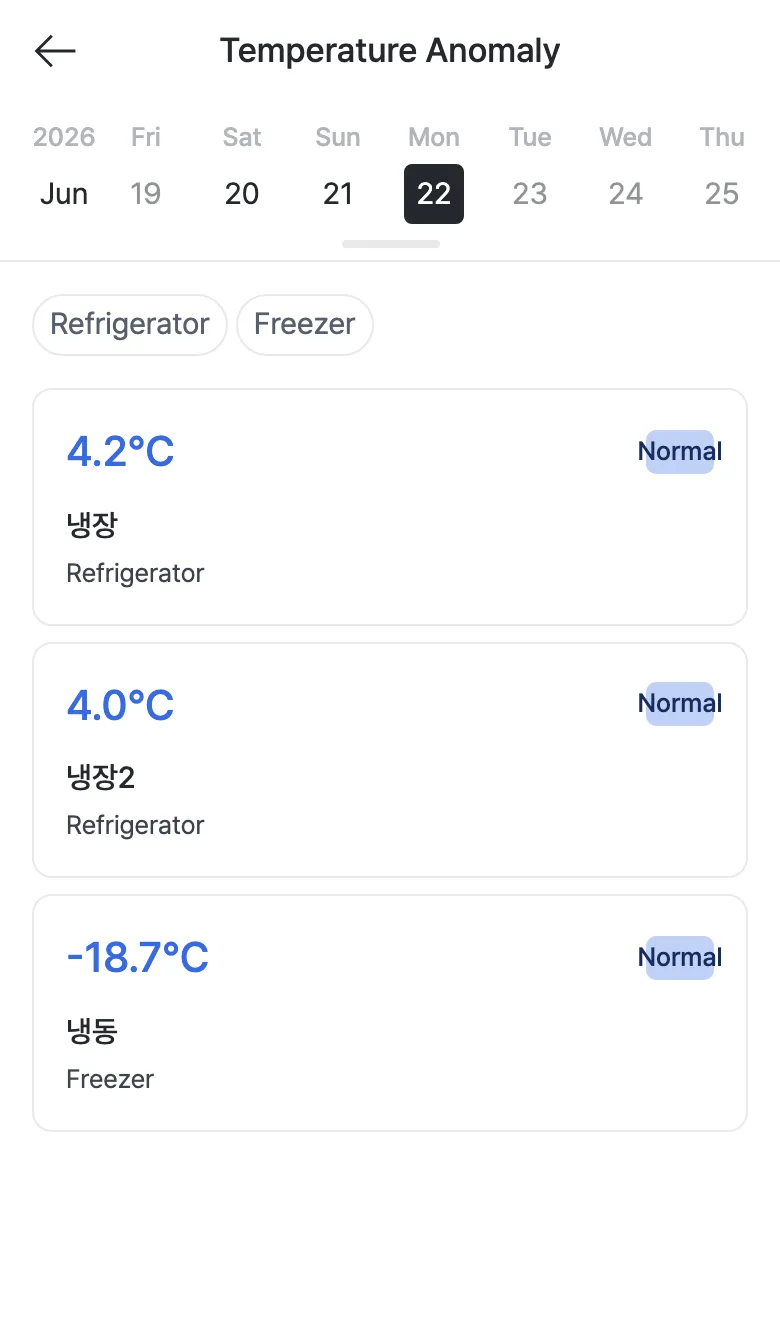
- Use the Refrigerator / Freezer filter at the top to narrow down by unit type.
- Each card shows the unit’s current temperature, name, type, and status (Normal/Danger).
- Tap a card to open the per-unit detail screen.
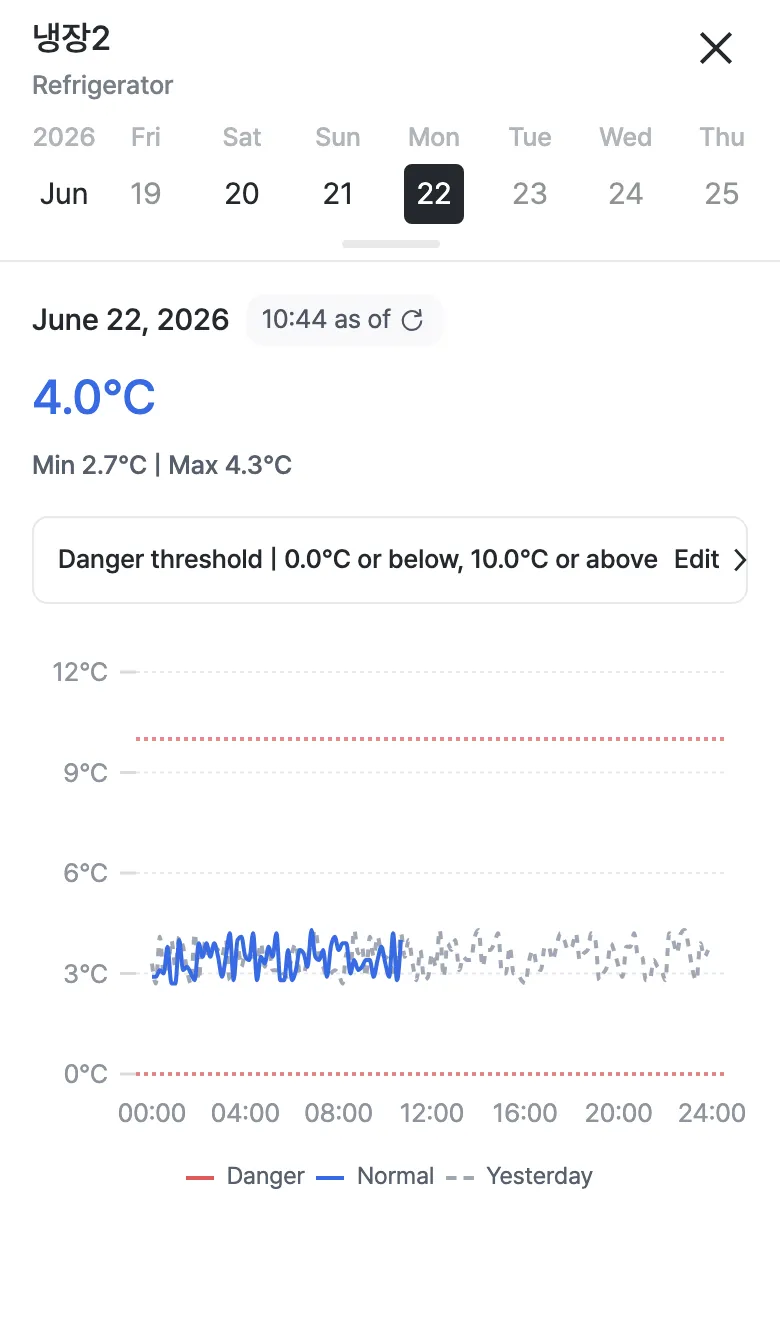
On the detail screen you can see the min/max temperature, the danger threshold (e.g. 0.0°C or below, 10.0°C or above), and the temperature graph over time (today vs. yesterday). When it crosses the threshold the graph turns red, and “Danger” appears when an out-of-threshold state lasts 30 minutes or more.
If there are no temperature anomalies, an empty screen is shown.