Timeline
The Timeline shows how each area’s status changed over the last 24 hours as a single bar per area. Enter it from an area card’s View Timeline or the View Timeline button below Store Score.
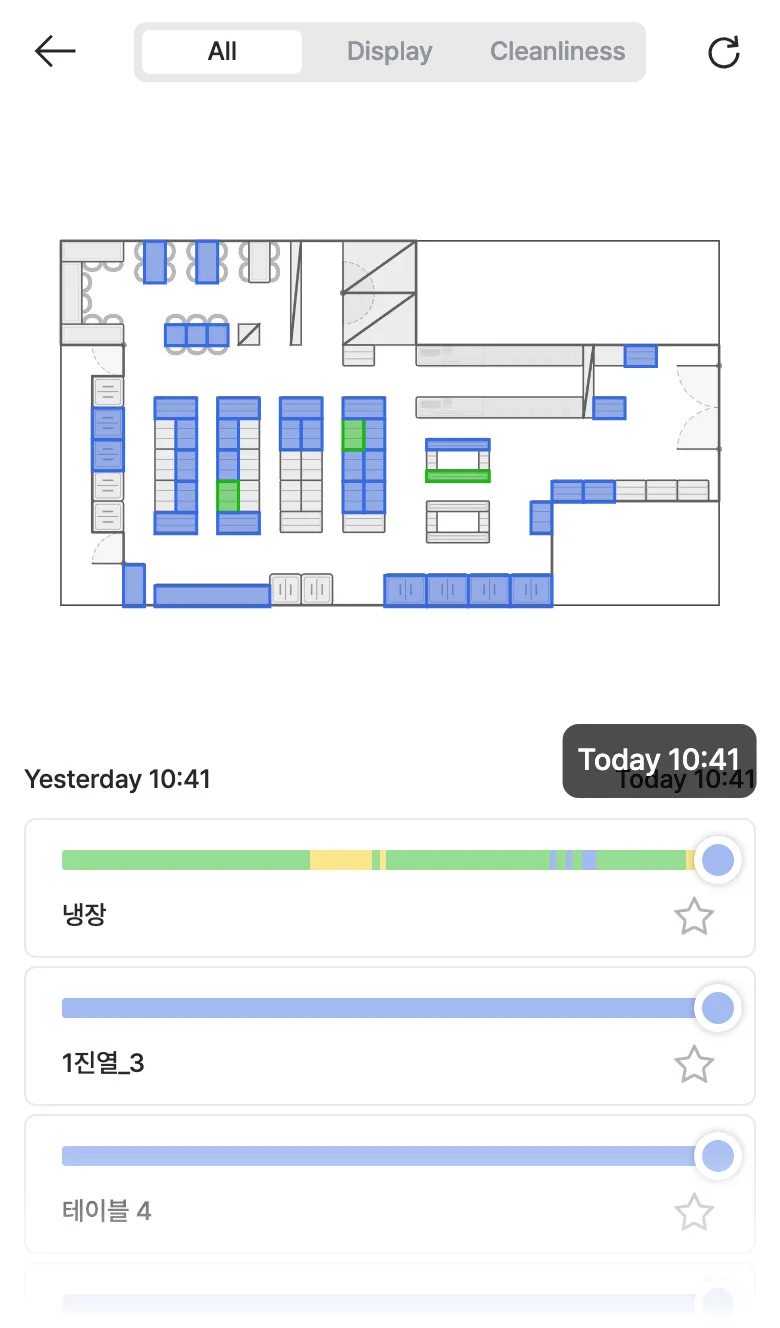
- Use the All · Display · Cleanliness tabs at the top to narrow down to what you want to see.
- The floor plan and a time scale (
Yesterday HH:MM~Today HH:MM) are shown together. - Each area bar changes color over time (Perfect/Good/Caution/Bad), and the circle at the right end is the current status.
- Tap the star (☆) on the right of a bar to pin that area to the top as a favorite.
If a certain area often turns red/yellow, it means that area is repeatedly disrupted. Use it to find which areas to review in your display/cleanliness routine.