Store Score · Stock Alert Area
Scroll further down the Real-time screen to see the Stock Alert Area and Store Score.
Stock Alert Area
Collects display areas that held a caution/bad status for 6 hours or more in the last 24 hours, so you can quickly spot shelves that empty out or get disrupted often. If there are none, it shows “There are no stock alert display areas.”
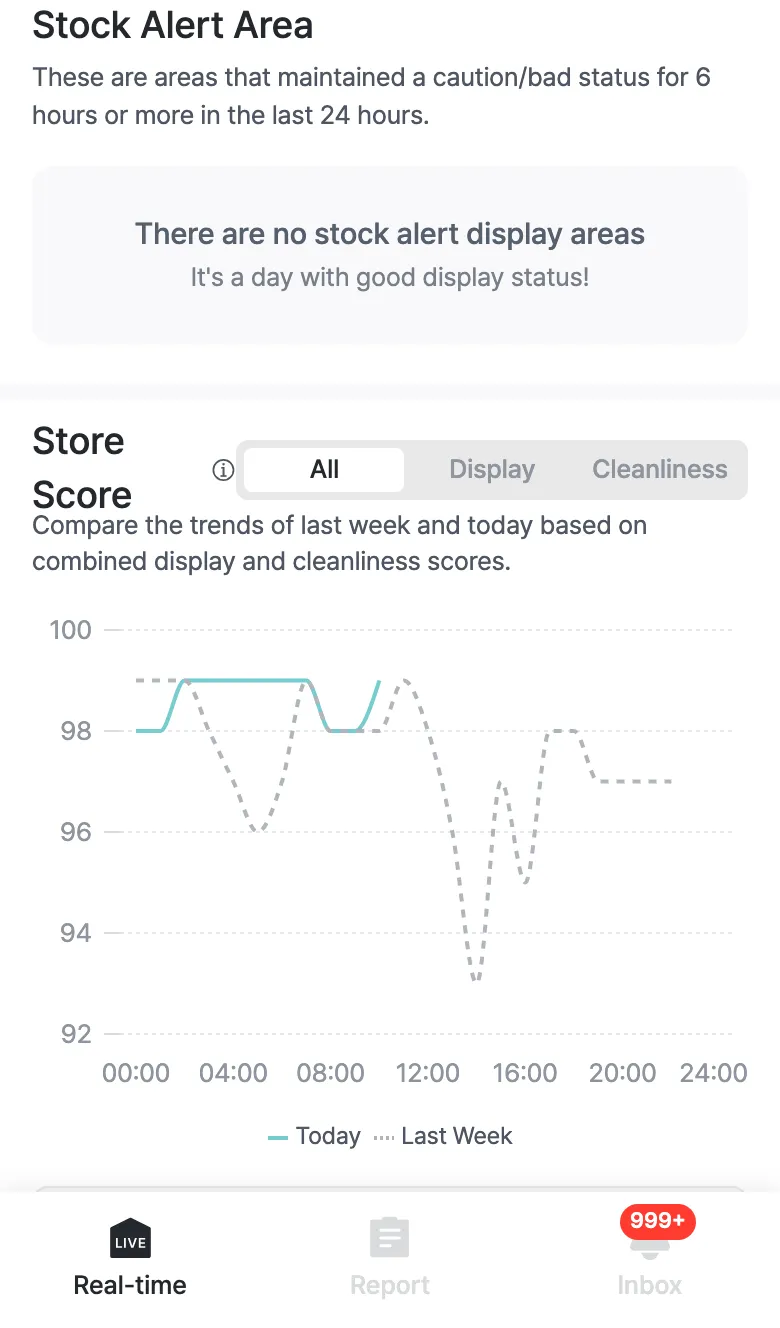
Store Score
Shows the daily trend of your Store Score, which combines display and cleanliness.
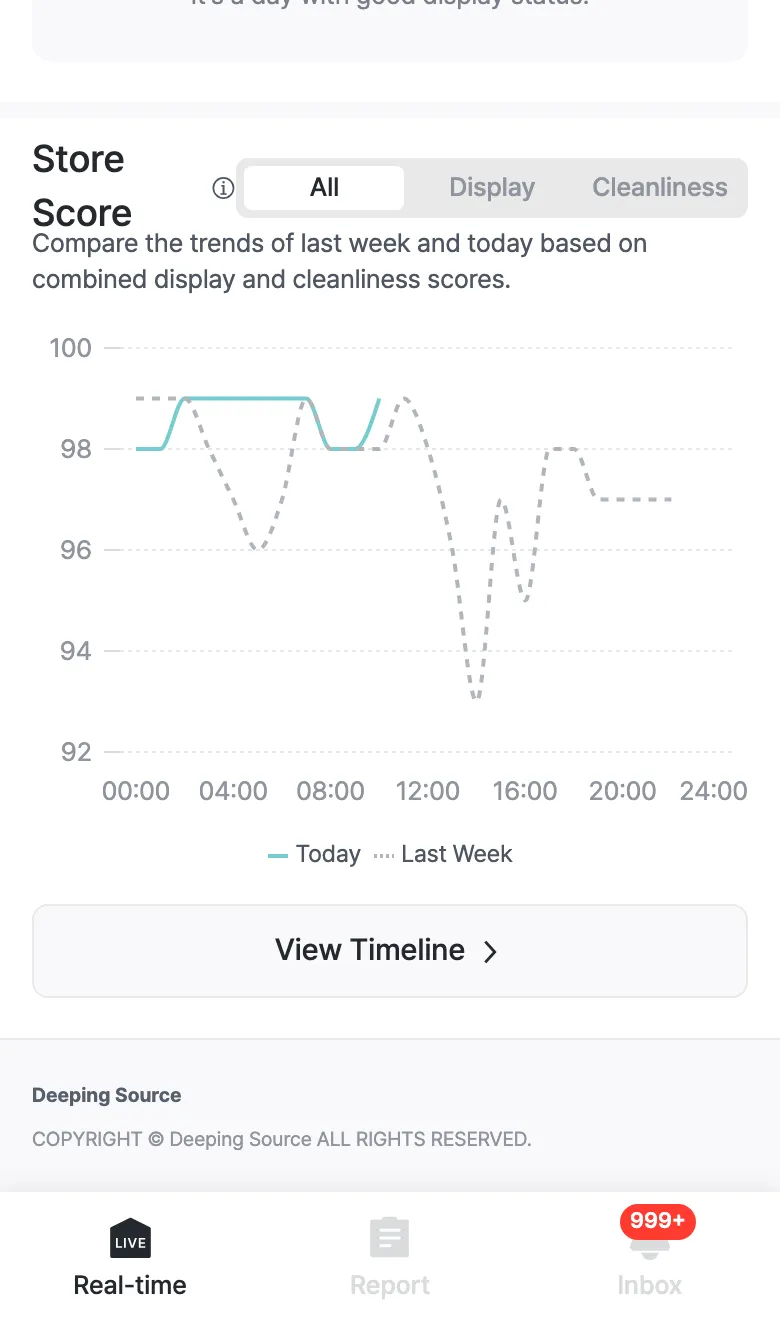
- Use the All · Display · Cleanliness tabs to break the score down.
- The graph overlays Today (solid) and the same weekday last week (dashed) so you can compare whether things are better or worse than usual.
- Use View Timeline below to look at the same span in detail on the Timeline.
How is the score calculated?
AI checks your store’s display and cleanliness every 5 minutes through CCTV and turns the status into a store score. A well-kept store stays around 100.
- Each zone’s status maps to points: Perfect 100 · Good 80 · Caution 60 · Bad 40. Zones with no data are excluded.
- When status improves quickly, points are added (the score can rise above 100); when a problem is left unattended, points are deducted (it can drop below 0).
- Each area score is the average of its zones’ points (counted when enough zones are reporting), and the final store score is the average of the two area (display, cleanliness) scores.
- The store score is shown as an hourly trend; reports show that day’s average, and the summary alert compares it to the same weekday last week.
A low score usually means a particular area (display or cleanliness) or zone stayed in “Caution/Bad” for a long time. Check the Timeline to see which zones were disrupted most often.